
11 major US cities where homes and apartments are becoming much more affordable
Homebuyers and renters have had plenty of headaches, but affordability is improving. Here are 11 major cities where buyers and renters can save money.
tunart/Getty Images
- Homebuyers and renters have had plenty of frustrations in the last few years.
- However, affordability improved by one key measure in 2024.
- Here are 11 major US cities where buyers and renters can save more money.
Affordability remains a major problem in the US real-estate market, but buyers and renters are getting a bit more breathing room in several major cities.
Millions of Americans were less than thrilled with their living situations in 2024 — a year marked by limited property transactions due to stubbornly high mortgage rates and inflated home prices.
Those looking to buy houses largely held off, which frustrated the homeowners looking to move. Younger renters were especially unlikely to purchase property, and although they've benefited as rent has steadily fallen from its post-pandemic peaks, it's still much more costly than in 2019.
However, recently released rental data from Realtor.com shows a few silver linings for both homebuyers and renters. The research firm found that median rent in the US declined on a year-over-year basis for the 18th straight month, even though the drop was modest at -0.2%.
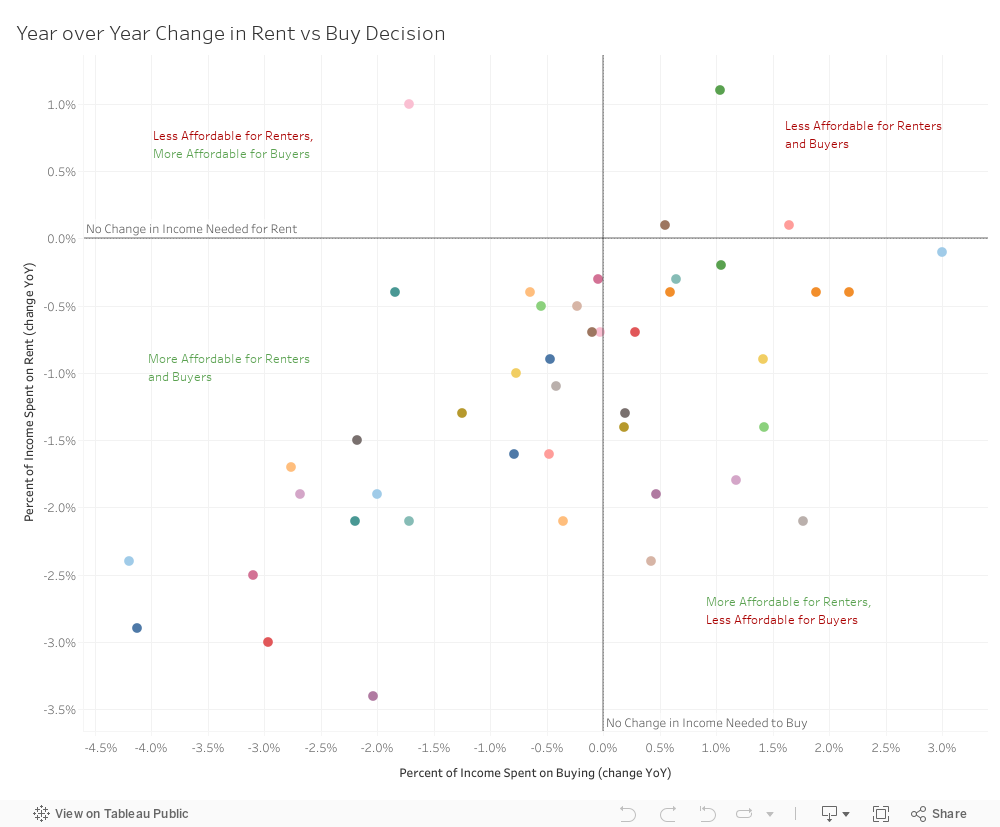
But the biggest takeaway is that affordability improved in a majority of the 50 largest US cities tracked by Realtor.com, as measured by the change in the share of money spent on housing.
Rent was a smaller percentage of budgets compared to 2023 in over 90% of major markets, Realtor.com found. And homebuyers put less of their income toward mortgage payments than they would have the year before in nearly two-thirds of the biggest metropolitan areas.
While massive cities like San Francisco and Miami aren't known for affordability, Realtor.com's findings indicate that buyers and renters there are able to save more money staying there than they would have a year prior, since the share of income going to landlords or lenders is smaller.
11 cities where affordability is improving
There are 11 cities where buyers and renters put a substantially smaller chunk of their money toward mortgages or rent on a percentage-of-income basis in 2024 versus the year before, according to Realtor.com. In each, the change in the share of income spent on buying or renting fell by at least 1.5 percentage points.
It's commonly accepted that people should spend 30% or less of their salary on housing costs. Buyers and renters are far exceeding that mark in some of the more expensive cities on this list, though everyone's financial situation is different.
Below are those markets — sorted by lowest rent to highest — along with each's median rent, the year-over-year change in rent, the share of income spent on rent and home purchases, and how that share has changed compared to the prior year.
f11photo/Getty Images
Median rent: $1,445
Year-over-year rent change: -3.5%
Share of income spent on rent: 19.5%
Change in share of income spent on rent: -2.1 percentage points
Share of income spent on buying: 29.3%
Change in share of income spent on buying: -1.7 percentage points
RYAN KYTE/Getty Images
Median rent: $1,467
Year-over-year rent change: -4.8%
Share of income spent on rent: 17.2%
Change in share of income spent on rent: -2.4 percentage points
Share of income spent on buying: 30.3%
Change in share of income spent on buying: -4.2 percentage points
Sean Pavone/Shutterstock
Median rent: $1,481
Year-over-year rent change: -0.3%
Share of income spent on rent: 20.3%
Change in share of income spent on rent: -1.5 percentage points
Share of income spent on buying: 30.2%
Change in share of income spent on buying: -2.2 percentage points
4kodiak/Getty Images
Median rent: $1,488
Year-over-year rent change: -3.5%
Share of income spent on rent: 20.4%
Change in share of income spent on rent: -2.1 percentage points
Share of income spent on buying: 36.6%
Change in share of income spent on buying: -2.2 percentage points
ESB Professional/Shutterstock
Median rent: $1,510
Year-over-year rent change: -1%
Share of income spent on rent: 22.1%
Change in share of income spent on rent: -2.5 percentage points
Share of income spent on buying: 29.4%
Change in share of income spent on buying: -3.1 percentage points
John Coletti/Getty Images
Median rent: $1,539
Year-over-year rent change: -2.5%
Share of income spent on rent: 21.7%
Change in share of income spent on rent: -1.7 percentage points
Share of income spent on buying: 38.6%
Change in share of income spent on buying: -2.8 percentage points
littlenySTOCK/Shutterstock
Median rent: $1,710
Year-over-year rent change: -1.6%
Share of income spent on rent: 28.1%
Change in share of income spent on rent: -1.9 percentage points
Share of income spent on buying: 34%
Change in share of income spent on buying: -2 percentage points
Rudy Balasko/Shutterstock
Median rent: $1,796
Year-over-year rent change: -5.6%
Share of income spent on rent: 20.2%
Change in share of income spent on rent: -3 percentage points
Share of income spent on buying: 33.4%
Change in share of income spent on buying: -3 percentage points
Bilanol/Shutterstock
Median rent: $2,328
Year-over-year rent change: -1.9%
Share of income spent on rent: 37.6%
Change in share of income spent on rent: -2.9 percentage points
Share of income spent on buying: 43.9%
Change in share of income spent on buying: -4.1 percentage points
Ron Thomas and Patty Thomas/Getty Images
Median rent: $2,695
Year-over-year rent change: -4.8%
Share of income spent on rent: 31.4%
Change in share of income spent on rent: -3.4 percentage points
Share of income spent on buying: 57.7%
Change in share of income spent on buying: -2 percentage points
Nicholas Klein/Getty Images
Median rent: $2,708
Year-over-year rent change: -3.3%
Share of income spent on rent: 24.3%
Change in share of income spent on rent: -1.9 percentage points
Share of income spent on buying: 41.4%
Change in share of income spent on buying: -2.7 percentage points